
Reports
1.Lead Source Conversion Report
Lead Source Conversions
The Conversion Report will stack up your Lead Sources to show you how well each are performing. The number of procedures that each Lead Source produces and the percentage of leads converted is also rendered.
Filter The Report
The conversion report allows you to assess the impact of your marketing activities. You can filter the data by various time periods, such as the previous month or 12 months. Additionally, you can view the “Last Attribution” and generate a “Conversion Report by Referrer” to gain deeper insights into your marketing performance.
Column Definitions
Total Patient Engagement Banner

Leads – The total of leads for your time frame.
Avg. Response time – Average response time of User sfirst contact attempt to leads.
Avg. # of Contact Attempts – Average number of attempts made to contact each lead.
The following breaks down each Column and what it represents.
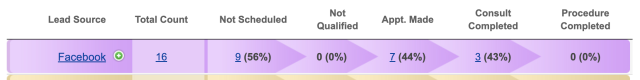
Lead Source – a link to see further breakdown of the medium used to connect with your practices, such as by Phone or Web Form Submission.
Total Count – the total number of qualified/valid Leads.
Not Scheduled – the total number of potential leads still not scheduled for any appointments.
Not Qualified – the total number of Leads that were marked Not Qualified
Appt. Made – the number of Leads that are currently scheduled for an Appointment or has had an Appointment that was marked completed (Consultations or Procedures)
Consult Completed – the number of Leads who have already been consulted, but has not completed a Procedure yet
Procedure Completed – the number of Leads who have completed a Procedure and who has been sent to your practice by this Lead Source.
The Percentages represents the percentage of the total number of Leads for this Lead Source. The above example LeadSource has a 2% Procedure Completion conversion.
*Conversion by Referrer – Just like the Conversion Report, this report provides a tally of total leads within the specified date range you selected, indicating whether they have been classified as Not Qualified or have progressed to an appointment, etc, based on the Referring Source. In MyMedLeads, a Referrer is identified as the source that directed the lead to the form’s location, such as PPC, Google Organic, Yelp, Facebook, and others.
2.Activity Report
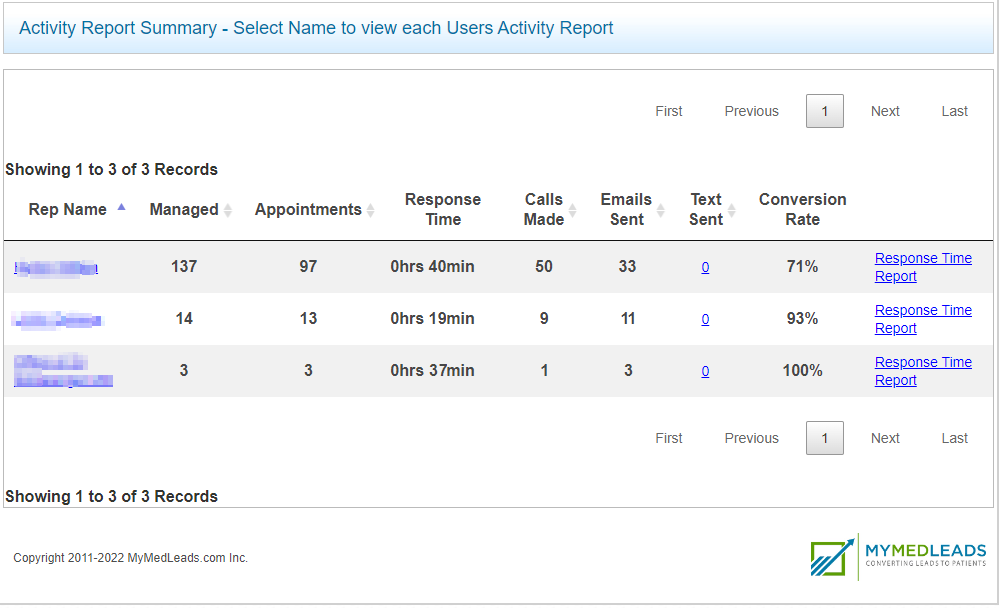
The activity report shows a listing of all active users of the account and an aggregate total of different activities that were performed for a certain time range. This report also renders the average time that it took for the members to respond to the leads. From this report you are able to go into a breakdown of how long it took the member to respond to individual leads.
Column Definitions
Rep Name – the name of the account member that is being reported on
Managed – the count of individual leads that were communicated to or actions performed on the lead by the account member. If the lead was managed by multiple account members, then this lead would be counted for both account members. The below listed activities are considered to be a managed activity and would be included within this column:
- Placing an Outbound Call using the “Call Now” button(s)
- Email Sent using the Send Email button and functionality within your account
- Adding a Note on the lead
- Scheduling or creating an appointment for the lead
- Canceling an existing appointment
- Setting a reminder for the account rep for that specific lead
- Converting the lead from MyMedLeads to your EMR/Scheduling Software
Appointments – the count of individual leads that were scheduled for an appointment (of any type) and that is not currently canceled or marked as a NoShow. If a lead was scheduled multiple times by multiple account members then that lead would be counted for each member that scheduled the appointment
Calls Made – the count of individual leads that a call was placed to using the “Call Now” button within the account. Automated Outbound Call feature does not need to be turned on for a lead to be included within this number, rather this column counts the number of leads that the account member used the Call Now button to retrieve the lead’s phone number. The report assumes that after the phone number was rendered that the account member called the lead.
Emails Sent – the count of individual leads that an email was composed and sent via the Send Email button within the lead details page.
Text Sent – the count of individual leads that a text communication was placed using the Two-Way Texting feature within MyMedLeads.
Conversion Rate – the calculated percentage between the unique number of leads, who were managed by the account member, and the number of scheduled appointments made by the account member. (Appointments Column divided by the Managed Columns multiplied by 100)
Please Note:
All of the above calculations for the Activity Report are based upon the selected time range and each metric only includes unique leads and a lead is not counted twice in any individual metric per row.
3.Multiple Reports
This tab presents reports that might already be accessible through the main dropdown menu or offers an alternative perspective on other reports listed in the View Reports dropdown.
Overview – This provides a summary of the total leads your practice has received each month over the past year, along with the number of those leads that scheduled a consultation, as indicated in the Conversion Report.
Staff Performance – This report is the same as the Activity Report (listed above).
Lead Source Tracking – This is a graph view of the total leads on your Conversion Report (by lead source).
Return on Investment – After entering patient revenue data in MyMedLeads, you can generate accurate Return on Investment (ROI) reports that detail the return for each of your lead sources. The Return on Investment report shows revenue broken down by lead source. However, you must first set up expenses by lead source in the Preferences > Edit ROI Expenses section. For additional details on ROI, please visit https://mymedleads.net/edit-roi-expenses/.
Patient Feedback – This report has its own tab on the main View Reports dropdown. (See Patient Feedback listed below)
4.Keyword and Referral Report
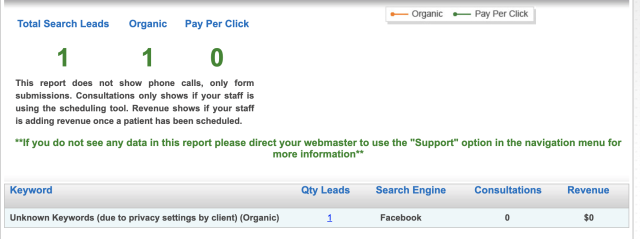
This report allows you to drill down to the leads level for all incoming Referral & Keyword sources. This report does not show phone calls, only form submissions. Consultations only shows if your staff is using the scheduling tool. Revenue shows if your staff is adding revenue once a patient has been scheduled.
5.Appointment Confirmation
Appointment Confirmation Report
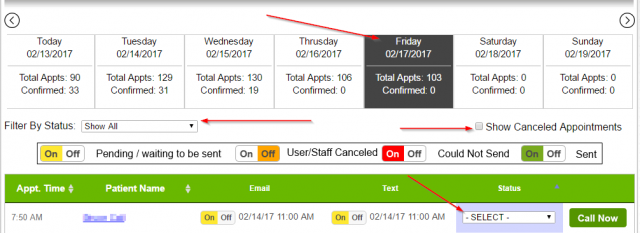
The appointment confirmation report provides an overview of all appointments for a single day, including the status of automated communications sent on your behalf, such as reminders and confirmations.
This report displays whether appointment confirmation emails and text notifications were sent and their confirmation status (e.g., confirmed, reschedule requested). Staff can adjust these statuses using a dropdown menu. By clicking on a patient’s name, staff can access their record to view contact details or click “Call Now” to display the patient’s phone number(s).
Key Features
– The report shows all sent reminders (one email and one text) and their confirmation statuses.
– Changes to appointment reminder settings typically take effect within a day.
– Patient responses to reminder texts appear in communication history, not the test dashboard.
– A sliding header allows users to view appointments for the past or upcoming week, with options to display canceled appointments and filter leads by confirmation status.
Color coding indicates communication status:
– **Green** means sent.
– **Yellow** indicates it’s pending.
-**Red** indicates it could not be sent.
-**Orange** indicates that it was canceled by a user/staff member.
You can change a patient’s status directly on this page. If a patient confirms electronically, their status will show as “Confirmed” with a green checkmark. If confirming by phone, staff can update the status accordingly.
If a patient requests to reschedule, their status will be marked as “Reschedule Request.” You can click “Call Now” to access their phone number. After rescheduling, change their status to “Managed.”
In case of an error marking the status, simply revert it using the dropdown menu. The report also shows the appointment time, assigned provider, and communication channel used to contact the patient.
6.Phone Call Summary
The Phone Call Summary Report provides valuable metrics on call tracking. It is a monthly report that displays the last 12 months of call data. The report offers a detailed review of a specific Call Tracking Phone Number, including all calls made to that number.
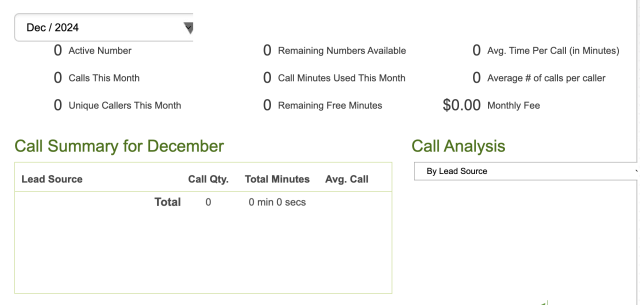
Key Metrics:
- Total number of calls per month
- Number of unique callers, broken down by phone line
- Average duration of phone calls
- Total duration of all phone calls
- Breakdown of incoming calls by day of the week
- Breakdown of incoming calls by hour of the day
7.Patient Feedback
If you have enabled Patient Reviews, you can use the Patient Feedback report to view the responses and outcomes.
The Patient Feedback report opens with an overview table. On the left, you’ll see a meter indicating the status. On the right, you’ll get a snapshot of the Patient Reviews you’ve received.

Clicking the “Read Internal Reviews” link at the bottom will take you to a full view of the internal patient reviews you have received. These reviews are private comments made by patients and are not automatically published on any external websites.

This review summary provides the following details:
- Feedback Date: The date the patient submitted the review
- Patient Name: The name of the patient who left the review
- Rating: The number of stars the patient gave in their review
- Message Type: Whether the patient replied to an email or text review request
- Comment: The full text of the patient’s review
- Review Status: Whether this is a new or existing review
- Provider: If reviews are enabled for multiple providers, which provider the patient saw
You also have the option to delete any of the existing reviews from MyMedLeads or export them for use on other platforms.
8.Campaign Report
The Campaign Report provides a straightforward breakdown of your campaign performance and communication results.
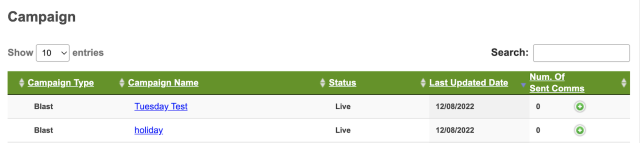
Campaign Type – This campaign is using a [procedural, post-consultation, blast, preop, or recall] campaign type.
Campaign Name – Clicking the Campaign Name will open a more detailed report, breaking down the data further (see more below).
Status – This informs you if the campaign your campaign is live (activated), pending, or deleted.
Last Updated Date – Whenever you update and reactivate the campaign, this will be updated to the most recent activation date.
Number of sent communications – MyMedLeads attempted to send a total of [X] emails or text messages. This includes any “dummy” emails that the lead may have provided. Clicking the plus sign will display a list of leads the information was sent to.
Campaign Report > Campaign Name
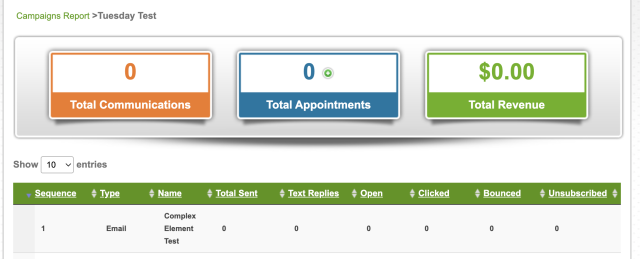
The first section provides an overview of the key points
Total Communications: Total emails and Texts sent for this campaign.
Total Appointments: Select to expand the results of patients who scheduled an appointment after receiving this campaign.
Total Revenue: This will only populate if you have set up ROI expenses.
The second section provides details on every communication, whether text or email, that was transmitted.
Sequence: The order of the email or text that was sent.
Type: Details on wether this was an email or a text
Name: Email/Text name being used for this campaign
Total Sent: Total sent for that communication
Text Replies: Total that replied to the marketing text. Because MML does not receive responses to marketing text messages, this functionality has been discontinued and will consistently display a value of 0.
Open: This can only be tracked for email communication. This is the total of emails that were opened by the leads.
Clicked: This is the total of how many people click on a link/url provided within the email.
Bounced: This is how many of these emails were bounced.
Unsubscribed: This is how many leads unsubscribed through this email communication.
9.Review Report
This report is for use with External Review only. The report will display the Total Feedback Messages sent:
Review Count – email and text total
Email count – how many emails for review requests were sent out
Text Count – how many texts for review requests were sent out.
Review Site
The number next to each review site name indicates how many times your patients clicked the link to that external site. However, this does not necessarily mean the patients left reviews on those sites – it only shows they clicked the link to access those sites.
Star Rating
The number next to each Star Rating indicates how many patients left you that star rating specifically. This does not mean that this start rating was posted anywhere, this rating is internal.

Clicking the number will display a list of the reviewers, the appointment date associated with the review, and the date the review was submitted.

10.*Conversion Report by User
This report is optional and must be activated by the MyMedLeads support team.
It is similar to the Conversion Report discussed earlier, but it specifically highlights the activities of individual users. It is crucial for staff to verify that leads are correctly assigned, ensuring that the right team member receives recognition for their contributions. This report is particularly beneficial for small, competitive sales teams. As a result, it may not be suitable for every practice, which is why it is not immediately available to all MyMedLeads accounts.